Homesweet Learning helps students learn!
Find the axis of symmetry of a parabola

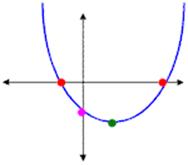
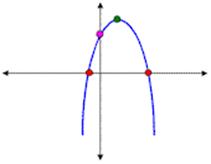
The graph of a quadratic function y = ax2 + bx + c is called a parabola. The following graphs are two typical parabolas:

For the sake of explanation, we mark their x-intercepts by red dots, their y-intercepts by a pink dot, and the vertex of each parabola by a green dot:

Description: Description: Description: Description: Description: Description: Description: http://www.csun.edu/~ayk38384/notes/mod11/parabola1.gifDescription: Description: Description: Description: Description: Description: Description: http://www.csun.edu/~ayk38384/notes/mod11/parabola2.gif

The horizontal position of the parabola curve is determined by the linear function

Description: Description: Description: Description: Description: Description: Description: http://www.csun.edu/~ayk38384/notes/mod11/Image132.gif

 And this vertical line is called axis of symmetry.